Google Colaboratoryを使ってみる

◆特徴
・Python、JupyterNotebookをブラウザ上で使える(PCの環境構築不要)。
・Tensorflow、Numpy、Matplotlib、Pandas、Keras、Chainer等が予め用意されている。
・GPU環境
その1. lena画像を表示する
・下記実行で画像をアップロードするためのアイコンが出てくる。
# 画像アップロード
from google.colab import files
uploaded = files.upload()

・アップされたようなので、これ↓で表示(^^
# 表示
from IPython.display import Image,display_jpeg
display_jpeg(Image('lena.jpg'))

その2. TensorFlowのtutrial(mnist)少しさわる
・手書き文字データのダウンロード→ ランダムに10個とって表示
import numpy as np
import matplotlib.pyplot as plt
from tensorflow.examples.tutorials.mnist import input_data

# mnistデータをダウンロード
mnist = input_data.read_data_sets("/tmp/data/", one_hot=True)

# 取出し 表示
images, labels = mnist.train.next_batch(10)

fig = plt.figure(figsize=(8,4))

for c, (image, label) in enumerate(zip(images, labels)):
    subplot = fig.add_subplot(2,5,c+1)
    subplot.set_xticks([])
    subplot.set_yticks([])
    subplot.set_title('%d' % np.argmax(label))
    subplot.imshow(image.reshape((28,28)), vmin=0,vmax=1,
                   cmap=plt.cm.gray_r, interpolation="nearest")
plt.show()

その3. OpenCVも使えるみたい
・画像の顔認識モジュールを使う
Qiita記事をみながら…
Colaboratory上でOpenCVを使って顔認識をしてみる
・OpenCV公式GitHubのカスケード分類器(haarcascade_frontalface_default.xml)をダウンロード → 上記同様のfiles.upload()でColaboratory上にファイルをアップロードする。その後下記実行。
import io
import numpy as np
import requests
import cv2
from matplotlib import pyplot as plt

# Web上の画像を読込み
res = requests.get('http://cinema.usc.edu/userfiles/A0127948311B99D1C02CF7783648D35EBD92E9B2images/Goonies2(1).jpg')

bin_data = io.BytesIO(res.content)
file_bytes = np.asarray(bytearray(bin_data.read()), dtype=np.uint8)

img = cv2.imdecode(file_bytes, cv2.IMREAD_COLOR)

# matplotで表示するためにBGR->RGBフォーマットに変換
img = cv2.cvtColor(img, cv2.COLOR_BGR2RGB)

# アップロードした分類器ファイルを使用
cascade = cv2.CascadeClassifier('./haarcascade_frontalface_default.xml')

# 検出
gray = cv2.cvtColor(img, cv2.COLOR_BGR2GRAY)
face = cascade.detectMultiScale(gray, scaleFactor=1.1, minNeighbors=3, minSize=(30, 30))

# 検出した領域を矩形で囲む
for (x, y, w, h) in face:
  cv2.rectangle(img, (x, y), (x + w, y + h), (200,0,0), 3)

# xy軸ラベル非表示
plt.grid(False)
plt.tick_params(labelbottom=False, labelleft=False, labelright=False, labeltop=False)
plt.imshow(img)

その4. Chainerも使える??
・Coraboratory上で次のようなインストールが必要とのこと
!apt-get install -y -qq libcusparse8.0 libnvrtc8.0 libnvtoolsext1
!ln -snf /usr/lib/x86_64-linux-gnu/libnvrtc-builtins.so.8.0 /usr/lib/x86_64-linux-gnu/libnvrtc-builtins.so
!pip install cupy-cuda80==4.0.0b4
!pip install chainer==4.0.0b4

その5. データのプロットの近似直線の表示
import numpy as np
import pandas as pd
import matplotlib.pyplot as plt

# numpyを使ってデータ生成
x = np.linspace(0,1,30)
y = np.random.rand(30)

# フィッティング直線
a, b = np.polyfit(x, y, 1)
y2 = a * x + b

# 表示関連
fig=plt.figure()

ax=fig.add_subplot(111)
ax.scatter(x,y,alpha=0.5,color="Purple",linewidths="1")
ax.plot(x, y2,color='Blue')

ax.text(0.1,a*0.1+b, 'y='+ str(round(a,4)) +'x+'+str(round(b,4)))

plt.show()
・Colaboratory上のグラフ表示

その6-1. Pythonを使って制御(一次遅れ系)のプロット描画
from sympy import *
from pylab import *

# 一次遅れ系 伝達関数 G(s)=K/(T*s+1), (T>0, K>0)
K,T = symbols('K T', positive=True)
s,t = symbols('s t')
G = Lambda((s, K, T), K/(T*s+1))

# ステップ応答信号 u(t)=1  ラプラス変換
U = Lambda(s, laplace_transform(1, t, s)[0]) # U(s)=1/s

# 一次遅れ系の単位ステップ応答 y(t) はY(s)=G(s)*U(s)=K/(s*(T*s+1)) の逆ラプラス変換
ilt = inverse_laplace_transform
y = Lambda((t, K, T), ilt(G(s,K,T)*U(s), s, t))

# K=1, T=5 の場合をプロット
trange = arange(0, 45, 0.1)
plot(trange, [y(t,1,5) for t in trange])
plt.axhline(1, color="gray", linestyle="--")

show()
・表示結果

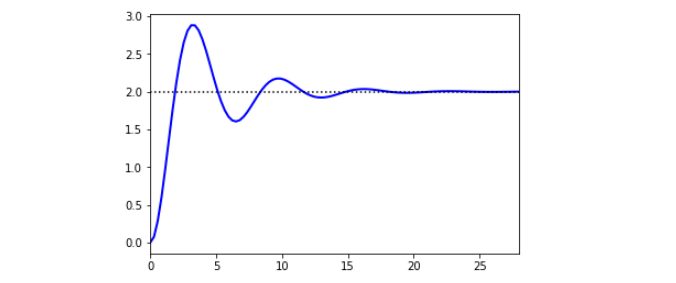
その6-2. 二次遅れ系のプロット描画
・とりあえず写経
import numpy as np
import matplotlib.pyplot as plt
from scipy import signal
from scipy.integrate import odeint

%matplotlib inline

# tau * dy2/dt2 + 2*zeta*tau*dy/dt + y = Kp*u

Kp = 2.0    # gain
tau = 1.0   # time constant
zeta = 0.25 # damping factor
theta = 0.0 # no time delay
du = 1.0    # change in u

# Transfer Function

num = [Kp]
den = [tau**2,2*zeta*tau,1]
sys1 = signal.TransferFunction(num,den)
t1,y1 = signal.step(sys1)

plt.figure(1)
plt.plot(t1,y1*du,'b-',linewidth=2,label='Transfer Fcn')

y_ss = Kp * du

plt.plot([0,max(t1)],[y_ss,y_ss],'k:')
plt.xlim([0,max(t1)])

plt.show()
・表示結果

・参考:
https://apmonitor.com/pdc/index.php/Main/ModelSimulation
その7. Fashionmnist+KerasのNN
・ファッションmnistを使った簡単なニューラルネットワークの学習
# 参考: http://uchidama.hatenablog.com/entry/2018/01/18/064500

# import libraries
import keras
import matplotlib.pyplot as plt
import numpy as np
import random
from matplotlib import cm
%matplotlib inline

# import modules# impor
from __future__ import print_function
from keras.datasets import fashion_mnist

# the data, shuffled and split between train and test sets
(x_train, y_train), (x_test, y_test) = fashion_mnist.load_data()

print('x_train shape:', x_train.shape)
print(x_train.shape[0], 'train samples')
print(x_test.shape[0], 'test samples')

print('x_train shape:',x_train.shape)
print('y_train shape:',y_train.shape)
print('x_test shape:',x_test.shape)
print('y_test shape:',y_test.shape)

print(type(x_test))
print(type(y_test[0]))

# show sample data、見てみる
fig = plt.figure(figsize=(9,9))

for i in range(25):
    ax = fig.add_subplot(5, 5, i+1, xticks=[], yticks=[])
    ax.imshow(x_train[i], cmap='gist_gray')

# 前処理
# reshape 28*28 pixel data into 784 dim data
# convert into float type and normalize pixel data from 0.0 to 1.0
x_train = x_train.reshape(60000, 784).astype('float32') /255
x_test = x_test.reshape(10000, 784).astype('float32') /255

# encode label data into "one-hot"
y_train = keras.utils.np_utils.to_categorical(y_train.astype('int32'),10)
y_test = keras.utils.np_utils.to_categorical(y_test.astype('int32'),10)

# モデルの層構造
# 2層のニューラルネットワーク、ドロップアウト無し
# 一般的なmnistの分類器ででf_mnistも分類できる

# Sequential Model# Sequen
from keras.models import Sequential
from keras.layers import Dense, Dropout, Activation
from keras.optimizers import RMSprop

# neural network structure
model = Sequential()
# 1st layer
model.add(Dense(100, activation='relu', input_shape=(784,)))
# 2st layer
model.add(Dense(100, activation='relu'))
# 3st layer
model.add(Dense(10, activation='softmax'))

# 学習
# Set definitions for traning
model.compile(loss='categorical_crossentropy',
              optimizer=RMSprop(),
              metrics=['accuracy'])

# Excute training for 10(epochs) times
history = model.fit(x_train, y_train, batch_size=128, epochs=10, verbose=1, validation_data=(x_test, y_test))

# 結果表示
# plot the resulut
plt.plot(history.history['acc'])
plt.plot(history.history['val_acc'])
plt.title('model accuracy')
plt.ylabel('accuracy')
plt.xlabel('epoch')
plt.legend(['train', 'test'], loc='upper left')
plt.show()


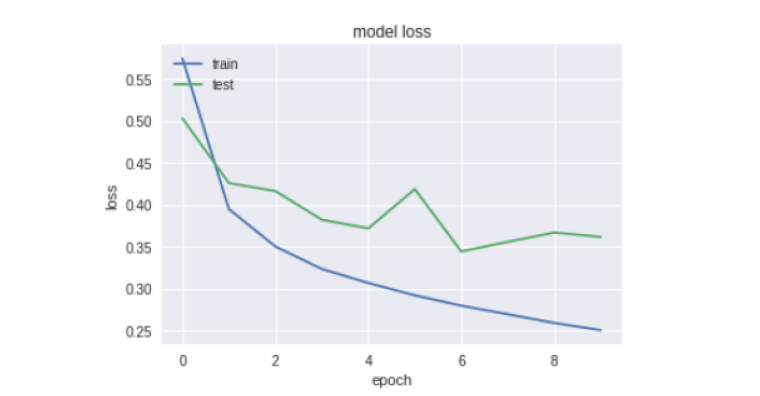
# plot the loss
plt.plot(history.history['loss'])
plt.plot(history.history['val_loss'])
plt.title('model loss')
plt.ylabel('loss')
plt.xlabel('epoch')
plt.legend(['train', 'test'], loc='upper left')
plt.show()


[google colaboratory、コラボレイトリー、Jupyter Notebook、Tensorflow、チュートリアル、画像表示、ファイルアップロード、ダウンロード、mnist]
2018-5-16