Tensorflow オートエンコーダでmnistを学習(Qiita記事を見ながら..)

◆目的:
・mnistデータをオートエンコーダで学習してみる。

◆キーワード:
・Tensorflow、オートエンコーダ、エンコード/デコード、mnist
・まず読込み。tensorflowのチュートリアル。mnistデータをダウンロード。
import tensorflow as tf
from tensorflow.examples.tutorials.mnist import input_data
import matplotlib.pyplot as plt
mnist = input_data.read_data_sets("MNIST_data/", one_hot=True)
・ニューラルネットワークの構造、ハイパーパラメータを決める。
h = 50
batch_size = 100
dropout_rate = 0.5
・重みやバイアスの定義
def weight_variable(shape):
    initial = tf.truncated_normal(shape, stddev=0.1)
    return tf.Variable(initial)

def bias_variable(shape):
    initial = tf.constant(0.1, shape=shape)
    return tf.Variable(initial)
・入力層を定義、データが入るところなので”placeholder”で。
x = tf.placeholder(tf.float32, [None, 784])
・隠れ層(W、b1)
W = weight_variable((784, h))
b1 = bias_variable([h])
・隠れ層の活性化関数はソフトサイン関数
h = tf.nn.softsign(tf.matmul(x, W) + b1)
keep_prob = tf.placeholder("float")
h_drop = tf.nn.dropout(h, keep_prob)
・出力層、変数、W2は転置、ReLu関数
・tf.transposeの例 こんな感じで行↔列が入れ替えられる

W2 = tf.transpose(W)
b2 = bias_variable([784])

y = tf.nn.relu(tf.matmul(h_drop, W2) + b2)
・損失関数
loss = tf.nn.l2_loss(y - x) / batch_size
・adamオプティマイザー、初期化、
train_step = tf.train.AdamOptimizer().minimize(loss)
init = tf.global_variables_initializer()
sess = tf.Session()
sess.run(init)
・トレーニング
for step in range(5000):
    batch_xs, batch_ys = mnist.train.next_batch(batch_size)
    sess.run(train_step, feed_dict={x: batch_xs, keep_prob: (1-dropout_rate)})

    # Collect Summary
    summary_op = tf.merge_all_summaries()

    # Print Progress
    if step % 200 == 0:
        print(loss.eval(session=sess, feed_dict={x: batch_xs, keep_prob: 1.0}))
⇒ 問題!
”module 'tensorflow' has no attribute 'merge_all_summaries'”のエラー
⇒ 対処
・記述を一部修正
tf.summary.merge_all
実行すると、誤差関数の値が順次更新(下がっていく)
38.9383
11.8077
9.61637
…略…
6.01636
6.32462
5.61356
・結果の出力
N_COL = 5
N_ROW = 1

plt.figure(figsize=(N_COL, N_ROW*2.5))
batch_xs, _ = mnist.train.next_batch(N_COL*N_ROW)
for row in range(N_ROW):
    for col in range(N_COL):
        i = row*N_COL + col
        data = batch_xs[i:i+1]

        # Draw Input Data(x)
        plt.subplot(2*N_ROW, N_COL, 2*row*N_COL+col+1)
        plt.imshow(data.reshape((28, 28)), cmap="gray", clim=(0, 1.0), origin='upper')
        plt.tick_params(labelbottom="off")
        plt.tick_params(labelleft="off")

        # Draw Output Data(y)
        plt.subplot(2*N_ROW, N_COL, 2*row*N_COL + N_COL+col+1)
        y_value = y.eval(session=sess, feed_dict={x: data, keep_prob: 1.0})
        plt.imshow(y_value.reshape((28, 28)), cmap="gray", clim=(0, 1.0), origin='upper')
        plt.tick_params(labelbottom="off")
        plt.tick_params(labelleft="off")

plt.savefig("result.png")
plt.show()

◆ 参考にした記事
http://qiita.com/mokemokechicken/items/8216aaad36709b6f0b5c
Python MLP 3層ニューラルネットワークの実装(Qiita記事を見ながらの写経)
◆ 参考とした記事「ディープじゃないディープラーニングをNumPyのみで超簡単実装してみた」
☞ フィッシャーのあやめデータセット使用する。
※3種類のあやめに関し、ガクの長さ、幅、花弁の長さ、幅等を測定したデータ

# Qiita ディープじゃないディープラーニング
# 2017-5-19 numpyMLPでアイリスデータを学習

import numpy as np

# ハイパーパラメータ

TRAIN_DATA_SIZE = 50  # 150個のデータのうちTRAIN_DATA_SIZE個を訓練データとして使用。残りは教師データとして使用。
HIDDEN_LAYER_SIZE = 6  # 中間層(隠れ層)のノード数(1層なのでスカラー)
LEARNING_RATE = 0.1  # 学習率
ITERS_NUM = 1000  # 繰り返し回数
DELTA = 0.01

# データを読み込み
# デフォルトで'#'の行を飛ばすようになっている

x = np.loadtxt('iris.tsv', delimiter='\t', usecols=(0, 1, 2, 3))
raw_t = np.loadtxt('iris.tsv', dtype=int, delimiter='\t', usecols=(4,))
onehot_t = np.zeros([150, 3])
for i in range(150):
    onehot_t[i][raw_t[i]] = 1

train_x = x[:TRAIN_DATA_SIZE]
train_t = onehot_t[:TRAIN_DATA_SIZE]
test_x = x[TRAIN_DATA_SIZE:]
test_t = onehot_t[TRAIN_DATA_SIZE:]

# 重み・バイアス初期化
W1 = np.random.randn(4, HIDDEN_LAYER_SIZE) * np.sqrt(2 / 4)  # Heの初期値(ReLUのときはこれを使う)
W2 = np.random.randn(HIDDEN_LAYER_SIZE, 3) * np.sqrt(2 / HIDDEN_LAYER_SIZE)
b1 = np.zeros(HIDDEN_LAYER_SIZE)  # 初期値ゼロ ※ゼロから作るDeep Learningを見てこうしたので理由はわからない
b2 = np.zeros(3)

# ReLU関数
def relu(x):
    return np.maximum(x, 0)

# Softmax関数
def softmax(x):
    e = np.exp(x - np.max(x))
    if e.ndim == 1:
        return e / np.sum(e, axis=0)
    elif e.ndim == 2:
        return e / np.array([np.sum(e, axis=1)]).T
    else:
        raise ValueError

# 交差エントロピー誤差
def cross_entropy_error(y, t):
    if y.shape != t.shape:
        raise ValueError
    if y.ndim == 1:
        return - (t * np.log(y)).sum()
    elif y.ndim == 2:
        return - (t * np.log(y)).sum() / y.shape[0]
    else:
        raise ValueError

# 順伝搬
def forward(x):
    global W1, W2, b1, b2
    return softmax(np.dot(relu(np.dot(x, W1) + b1), W2) + b2)

# テストデータの結果
test_y = forward(test_x)
print((test_y.argmax(axis=1) == test_t.argmax(axis=1)).sum(), '/', 150 - TRAIN_DATA_SIZE)

# =>
35 / 100

# 学習ループ
for i in range(ITERS_NUM):
    # 順伝搬withデータ保存
    y1 = np.dot(train_x, W1) + b1
    y2 = relu(y1)
    train_y = softmax(np.dot(y2, W2) + b2)

    # 損失関数計算
    L = cross_entropy_error(train_y, train_t)

    if i % 100 == 0:
        print(L)

    # 勾配計算
    # 計算グラフで求めた式を使用
    a1 = (train_y - train_t) / TRAIN_DATA_SIZE
    b2_gradient = a1.sum(axis=0)
    W2_gradient = np.dot(y2.T, a1)
    a2 = np.dot(a1, W2.T)
    a2[y1 <= 0.0] = 0
    b1_gradient = a2.sum(axis=0)
    W1_gradient = np.dot(train_x.T, a2)

    # パラメータ更新
    W1 = W1 - LEARNING_RATE * W1_gradient
    W2 = W2 - LEARNING_RATE * W2_gradient
    b1 = b1 - LEARNING_RATE * b1_gradient
    b2 = b2 - LEARNING_RATE * b2_gradient

# =>
7.67570464895
0.393484233191
0.282570757345
0.197404306772
0.131109443642
0.0944027334525
0.069999080593
0.0396633772518
0.0309149715653
0.0261644638179

# 最終訓練データのL値
L = cross_entropy_error(forward(train_x), train_t)
print(L)

# テストデータの結果、正解率

test_y = forward(test_x)
print((test_y.argmax(axis=1) == test_t.argmax(axis=1)).sum(), '/', 150 - TRAIN_DATA_SIZE)
0.022632216217

# =>
97 / 100
Python 手書き文字mnistに触ってみる(その2)
◆Scikit learnの8x8digitを触ってみる @ 2017-5-14
# Scikit learnではじめる機械学習 p.223@Pythonの教科書
# Scikit learnは予めダウンロード      2017-5-14

from sklearn import datasets
# sklのデータセット読込み
digits = datasets.load_digits()

# imageプロパティ、、、画像のピクセルデータ
print(digits.images[15])
# targetプロパティ、、、ラベル情報
print('正解ラベル -', digits.target[15])

# とりあえず1つ選ぶ これを下で描画
selecteddata = digits.images[5]


# 描画コード、cm ??
# plt.imshow(対象データ、形状、cmap、インターポレーション)

from matplotlib import pyplot as plt, cm

plt.imshow(selecteddata.reshape(8,8), cmap=cm.gray_r, interpolation='nearest')
plt.show()
[[ 0. 5. 12. 13. 16. 16. 2. 0.]
[ 0. 11. 16. 15. 8. 4. 0. 0.]
[ 0. 8. 14. 11. 1. 0. 0. 0.]
[ 0. 8. 16. 16. 14. 0. 0. 0.]
[ 0. 1. 6. 6. 16. 0. 0. 0.]
[ 0. 0. 0. 5. 16. 3. 0. 0.]
[ 0. 1. 5. 15. 13. 0. 0. 0.]
[ 0. 4. 15. 16. 2. 0. 0. 0.]]
正解ラベル - 5

Python ど基本(その2)※その1は削除(^^;

◆関数の基本
(1)かけ算をする関数
def mul(a,b):
    '''かけ算の関数''' # docstring
    return a * b

print(mul(3,4))
=> 12
(2)円の面積を計算する関数
#関数の基本と引数、リターン
def circle(radius):

    result = radius * radius * 3.14

    return result

circle(10)

# circle関数の引数に10を代入
# circle(10)まで読むと即計算、314.0をoutする。
=> 314.0
◆命令イロイロ
●print文
・python3では「関数」(構文ではなく。。)
・print('abc') ※python2,3で互換性
・print(***.shape)・・・形状を表示する
print(x_train[15].shape) #トレーニング用データの15番目のシェイプ
=>
(784,)
・改行させない
print(***, end="")
◆import
・os.pardirは親ディレクトリを表す文字列定数
・sys.pathはファイルを検索するパスを示す文字列のリスト。
→ sys.pathにインポート対象のディレクトリを含めることで、適当なディレクトリのファイルでもインポート可となる。
from モジュール名 import 属性1, 属性2…
(1)親ディレクトリにあるファイルをインポートする
import sys,os
sys.path.append(os.pardir)
#このあとに例えば。。
import abc #abc.pyをインポート
◆for文
(1) リスト、要素1つずつ表示
list = [ 'Nasu', 'Tomato', 'Kyuri' ]
for x in list :
         print(x)
=>
Nasu
Tomato
Kyuri
(2)1つ飛ばし
for x in list[1:] :
         print(x)
=>
Tomato
Kyuri
◆ディクショナリ
# ディクショナリを作成 2017-11-14@ゼロから作る7ページ
me = {'height':180}
# 要素にアクセス
me['height']
=> 180
# ディクショナリ内に新しい要素を追加
me['weight'] = 70
print(me)
=> {'height': 180, 'weight': 70}
◆Memo:
●Pythonの「型」
(1)str()
(2)float()
(3)int()
・型を調べたいとき
type()
TensorFlow 触りはじめ
◆tensorflow動作テスト用のプログラム

(1)”Hello World!”を表示させる
import tensorflow as tf

hello = tf.constant('hello World!')
sess = tf.Session()

print(sess.run(hello))
(2)単純な行列計算をするプログラム
# XとYの積を求めるプログラム
import tensorflow as tf

X = tf.constant([[3.,3.]])
Y = tf.constant([[2.],[2.]])

# XとYの積を計算するノードを作成
node = tf.matmul(X, Y)

# 実行する
sess = tf.Session()
result = sess.run(node)

print(result) # [[12.]]
(3)mnistデータからランダムに10個取り出し、表示する
# tensorflowでmnistデータをさわる、10個ランダム抽出、表示
import numpy as np
import matplotlib.pyplot as plt
from tensorflow.examples.tutorials.mnist import input_data

mnist = input_data.read_data_sets("/tmp/data/", one_hot=True)

# 10個のデータを取り出す、変数mnistのメソッド
images, labels = mnist.train.next_batch(10)

# 1つ目のデータ内容を表示、ラベル&中身
print(labels[0])
print(images[0])

#  取り出した10個を画像として表示
fig = plt.figure(figsize=(8,4))
for c, (image, label) in enumerate(zip(images, labels)):
    subplot = fig.add_subplot(2,5,c+1)
    subplot.set_xticks([])
    subplot.set_yticks([])
    subplot.set_title('%d' % np.argmax(label))
    subplot.imshow(image.reshape((28,28)), vmin=0,vmax=1, cmap=plt.cm.gray_r, interpolation="nearest")
plt.show()

# Extracting /tmp/data/train-images-idx3-ubyte.gz
# Extracting /tmp/data/train-labels-idx1-ubyte.gz
# Extracting /tmp/data/t10k-images-idx3-ubyte.gz
# Extracting /tmp/data/t10k-labels-idx1-ubyte.gz
# [ 0.  0.  0.  0.  0.  0.  1.  0.  0.  0.]
# [ 0.          0.          0.          0.          0.          0.          0.
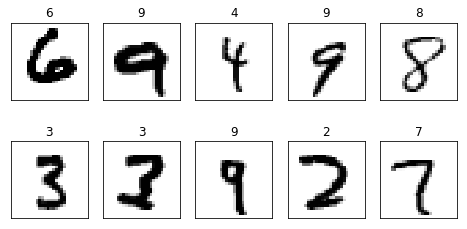
・”imshow”メソッド・・・画像を表示
・”cmap=plt.cm.gray_r”・・・グレースケールで表示
・”vmin””vmax”・・・濃度の最大値/最小値、濃淡を適切に調整
・”interpolation="nearest"”・・・画像を滑らかに表示する機能を無効化
◆メモ1
・mnistの分類アルゴリズムについて・・・数学的に言えば784次元のベクトルであり、784次元空間の1つの点(x1,x2,,,x784)に対応することになる。784次元は絵では示せないが、その空間を10個の領域に分割して、分類を行うという意味では、二次元平面の分類と類似。
◆メモ2(API、計算)
☞ tf.Session()・・・処理を実行するためのクラス
☞ with句・・・セッションを記述。
☞ fetch・・・グラフから演算結果を取り出す。
☞ tf.constant・・・定数。定数の行列要素を生成。
☞ input_data・・・外部データを読み込む関数(cf.mnist)
☞ placeholder・・・データが格納される予定地。
・Noneにしておくと可変サイズに対応可
☞ tf.assign・・・変数に値を代入。
◆TensorFlow
・グラフ(エッジ+ノード)という処理概念を使っている。
・グラフを実行するためには、sessionを作りrunメソッドをコール。
・約1000のAPIが公開。
◆インストール(mac)
・公式ページを参考
・conda インストール(python 3.6)
◆参考サイト
・TF参考
TensorFlowで学ぶディープラーニング入門備忘録【第2章】 - ハードウェアエンジニアの備忘録
Python 手書き文字mnistデータを触ってみる
◆mnistデータを用意
・トレーニングデータが60000(画像&ラベル)、テストデータが10000(画像&ラベル)
・ゼロから分かるディープラーニングのgithubからダウンロード

◆ 内容
t_train, t_train, x_test, t_test
◆さわりはじめ
(1)とりあえず”dataset.mnist”モジュールから”load_mnist”をインポート
import sys, os
sys.path.append(os.pardir)
from dataset.mnist import load_mnist
(2)定義する
(x_train, t_train), (x_test, t_test) = load_mnist(flatten=True, normalize=False)
(3)テストデータの形状を確認
print(x_train.shape)
print(x_test.shape)
=>
(60000, 784)
(10000, 784)
◆”load_mnist”
・load_mnist(トレーニング画像, ラベル),(テスト画像, ラベル)の形式でmnistデータを返す。
・load_mnist(normalize=False, flatten=True, one_hot_label=Fals)のように引数設定。
◆画像の表示・・・PIL:python image libraryモジュールを使う
from PIL import Image
☞ ”トレーニング”の15番目を見てみる
print(x_train[15]) # mnistデータの”x_train”の15番目を表示


※28x28になっていない、8ビット
# ”トレーニングデータラベル”の1番目を見てみる
print(t_train[15])
=>
7 #「7」とのこと
☞ 28x28にする
image = x_train[15].reshape(28,28) #"reshape"で形を整える
print(image)

※28x28になっているけどjupyternotebookで改行
☞ ゼロから学ぶDLの関数を使う
# 関数を定義
def img_show(img):
pil_img = Image.fromarray(np.uint8(img))
pil_img.show()


☞ とりあえず作業痕跡。。
(1)その1

(2)その2

◆触れたこと
☞ scikit-learn (サイキット・ラーン) ・・・機械学習ライブラリ
from sklearn.utils import shuffle
from sklearn.model_selection import train_test_split
from sklearn.metrics import f1_score
from sklearn.datasets import fetch_mldata
☞ fetch_mldata()・・・scikit-learnの関数、webからmnistデータをもってくる。
例)
mnist = fetch_mldata('MNIST original')
☞ shuffle / random_state=**
☞ split
☞ could not read bytes
・中途半端なデータが残っているせいか。scikit_learn_data/mldataのフォルダごと削除して再度やり直し。
◆参考
☞ Pythonマニュアル
https://docs.python.jp/3/tutorial/index.html
☞ scikit-learn
http://scikit-learn.org/stable/tutorial/machine_learning_map/
☞ 参考
http://tawara.hatenablog.com/entry/2016/11/06/DeepLearningFromZero-04
https://openbook4.me/sections/1452
Memo 用語&単語 etc

◆Python&機械学習関連の用語
・パーセプトロン…重み設定の作業が人手。活性化関数がステップ関数。@魚本
・ニューラルネットワーク…ニューロンのつながり方はパーセプトロンと何ら変わりなし。多層で、シグモイド関数などの滑らかな活性化関数を使用するネットワーク。@魚本
・活性化関数…入力信号の総和がどのように活性化(発火)するかを決める役割りを果すもの。@魚本
・正規化(normalization)…データをある決まった範囲に変換する処理@魚本
・損失関数(loss function)…「ニューラルネットワークの学習では、最適なパラメータ(重みとバイアス)を探索する際に、損失関数の値ができるだけ小さくなるようなパラメータを探します。」2乗和誤差、交差エントロピー誤差などを用いる。「できるだけ小さな損失関数の場所を探すために、パラメータの微分(正確には勾配)を計算し、その微分の値を手がかりにパラメータの値を徐々に更新していきます。」@魚本
・2乗和誤差…「ニューラルネットワークの出力と正解となる教師データの各要素の差の2乗を計算し、その総和を求めます。」@魚本
・偏微分…「…ある場所の傾きを求めます。ただし、…変数をひとつに絞り、他の変数はある値い固定します。」@魚本
・勾配…「すべての変数の偏微分をベクトルとしてまとめたもの」@魚本
・勾配法…「勾配をうまく利用して関数の最小値(または、できるだけ小さな値)を探そう、というのが勾配法です。」@魚本
・学習率(learning rate)…「1回の学習で、どれだけ学習すべきか、どれだけパラメータを更新するか、ということを決めるのが学習率です。」@魚本
・ハイパーパラメータ…人の手によって設定されるパラメータ
・誤差逆伝播法…「局所的な微分」の伝達@魚本
・畳込みフィルタ…「画像に描かれている物体の特徴をより的確に捉えることが可能になります」@中井マイナビ本、p27
・点でなく領域ベースで特徴抽出できるので移動変形に強くなる。また、エッヂ抽出など領域ベースでないと分からないような特徴も抽出可となる。@Qiita
・プーリング層…「画像の解像度を落とす処理を行います。…詳細をあえて消し去ることで、描かれている物体の本質的な特徴のみを抽出しようという発想に基づきます。」@中井マイナビ本、p27
・サイズを圧縮して後の層で扱いやすくできるメリット@Qiita
==未整理==
・broadcasting… 形状の違う配列どうしを計算。
・category表現…[0, 1, 2, 1, 0, 2]
・one-hot 表現…[ 1., 0., 0.] 要素1つが1で他が全て0
・リスト…要素のシーケンス、挿入&削除ができる、ミュータブル
a=[1,2,3]
print(a)
=>
[1, 2, 3]
・タプル…イミュータブル、変更不可
a=(1,2,3)
print(a)
=>
(1, 2, 3)
Python Numpyに慣れる100エクササイズ
◆ベクトルを作る・いじる

☞ ”array” ・・・要素指定で配列を生成する
print(np.array([[1, 2, 3], [4, 5, 6]]))
=>
[[1 2 3]
[4 5 6]]
☞ ”arange”・・・連番の配列を作る
print(np.arange(5)) # start = 0 (default), end = 5
print(np.arange(1,5)) # start = 1, end = 5
print(np.arange(1,5,0.5)) # start = 1, end = 5, slice = 0.5
=>
[0 1 2 3 4]
[1 2 3 4]
[ 1. 1.5 2. 2.5 3. 3.5 4. 4.5]
☞ ”flatten”・・・一次元化
W = np.array([[1, 2, 3], [4, 5, 6]])
print(W)
print(W.flatten())
=>
[[1 2 3]
[4 5 6]]
[1 2 3 4 5 6]
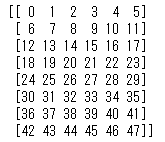
☞ ”reshape”・・・行列のかたちを変更
print(np.arange(48).reshape(8, 6))
=>
A = np.arange(24).reshape(2,3,4) #2つの行列に分ける
print(A)
=>
[[[ 0 1 2 3]
[ 4 5 6 7]
[ 8 9 10 11]]
[[12 13 14 15]
[16 17 18 19]
[20 21 22 23]]]
☞ ”shape”・・・配列の値の数を得る
(1) 3x2行列.shape → (3,2)
(2)3x2行列.shape [0]→ 行の数 この例では3
ex:
X = np.arange(12).reshape(3,4)
print(X)
=>
[[ 0 1 2 3]
[ 4 5 6 7]
[ 8 9 10 11]]
ex:
print(X.shape)
print(X.shape[0])
=>
(3, 4)
3
ex:
b = np.array([2,4,6,8])
print(b.shape)
=>
(4,)
☞ ”zeros”・・・全部0の配列を作る (cf. 全部1なら”ones”)
Z1 = np.zeros(5) #一次元
Z2 = np.zeros*1 #2行3列のように形状指定もOK
print(Z1)
print(Z2)
=>
[ 0. 0. 0. 0. 0.]
[[ 0. 0. 0.]
[ 0. 0. 0.]]
・参考)4つ目が1
Z = np.zeros(10)
Z[4] = 1
print(Z)
=>
[ 0. 0. 0. 0. 1. 0. 0. 0. 0. 0.]
☞ ”np.random.choice()”・・・ランダム
・指定された数字の中からランダムに好きな数を取り出す
np.random.choice(100,3) #0〜99のうちランダムに3つ数字を抽出
=>
array([89, 41, 92])
◆ ”def”・・・関数を定義
def add(x, y):
print x + y
add(3, 5)
=> 8
◆ ”numpy.newaxis”・・・縦配置
(1)ヨコ→タテ
array = np.arange(5)
print (array[:, np.newaxis])
=>
[[0]
[1]
[2]
[3]
[4]]
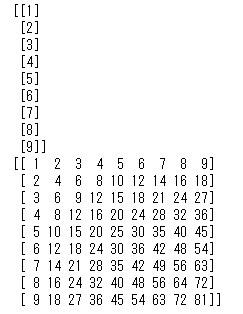
(2)九九表を作る
m = np.array([1,2,3,4,5,6,7,8,9])
n = np.array([1,2,3,4,5,6,7,8,9])
print(m[:, np.newaxis]) # m配列を縦に
print(m[:, np.newaxis]*n) # それにn配列を掛け算していく
☞ その7・・・エレメントをリバースする
Z = np.arange(15)
Z = Z[::-1]
print(Z)
=>
[14 13 12 11 10 9 8 7 6 5 4 3 2 1 0]
☞ その8・・・3x3のマトリクス
Z = np.arange(9).reshape(3,3)
print(Z)
=>
[[0 1 2]
[3 4 5]
[6 7 8]]
☞ その9・・・ある行列からindexをさがす
nz = np.nonzero([1,2,0,0,4,0])
print(nz)
=>
(array([0, 1, 4], dtype=int64),)
☞ その10・・・identity matrix 単位行列
Z = np.eye(3)
print(Z)
=>
[[ 1. 0. 0.]
[ 0. 1. 0.]
[ 0. 0. 1.]]
☞ その11・・・3x3x3のランダム行列の作成
Z = np.random.random*2
print(Z)
=>
[[[ 0.86816012 0.54928482 0.10620469]
[ 0.56253858 0.42498644 0.38111299]
[ 0.46583937 0.06876381 0.47205835]]
[[ 0.48659812 0.53796306 0.83180752]
[ 0.54321802 0.2645361 0.6461197 ]
[ 0.69551154 0.60727098 0.36739499]]
[[ 0.31582316 0.86979075 0.77204474]
[ 0.93540842 0.18592936 0.17472491]
[ 0.87547108 0.59652846 0.87853689]]]
☞ その12・・・3x3のランダム行列を作り、その中の要素の最大値/最小値を抽出
Z = np.random.random*3
Zmin, Zmax = Z.min(), Z.max()
print(Z)
print(Zmin, Zmax)
=>
[[ 0.92771297 0.99119487 0.33149293]
[ 0.48005022 0.61086498 0.19062979]
[ 0.05214626 0.61618909 0.08295882]]
0.0521462614894 0.991194872459
☞ その13・・・要素の平均値(mean value)を出す
Z = np.random.random(3)
m = Z.mean()
print(Z)
print(m)
=>
[ 0.43252845 0.86545314 0.8868291 ]
0.728270233139
☞ その16・・・対角の1つ下の行列を作る、1~4、diagonal
Z = np.diag(1+np.arange(4),k=-1)
print(Z)
=>
[[0 0 0 0 0]
[1 0 0 0 0]
[0 2 0 0 0]
[0 0 3 0 0]
[0 0 0 4 0]]
☞ その17・・・チェックボードパターンの行列
Z = np.zeros*4
print(Z)
=>
[[0 1 0 1]
[1 0 1 0]
[0 1 0 1]
[1 0 1 0]]
☞ その20・・・Normalize(最大が1&最小が0になる)
Z = np.random.random*5
Zmax, Zmin = Z.max(), Z.min()
Z = (Z - Zmin)/(Zmax - Zmin)
print(Z)
=>
[[ 0.91425657 0.07881159 1. ]
[ 0.63918169 0.58862944 0.43357481]
[ 0.4049732 0.1090024 0. ]]
☞ その21・・・Create a custom dtype that describes a color as four unisgned bytes
☞ その22・・・Multiply a 5x3 matrix by a 3x2 matrix (real matrix product)
☞ その23・・・1~10のうち3~8をnegateする
Z = np.arange(11)
Z[(3 < Z) & (Z <= 8)] *= -1
print(Z)
=>[ 0 1 2 3 -4 -5 -6 -7 -8 9 10]
☞ その24・・・Consider an integer vector Z, which of these expressions are legal
☞ その27・・・How to round away from zero a float array ?
Z = np.random.uniform(-10,+10,10)
print (np.trunc(Z + np.copysign(0.5, Z)))
=>
[ -8. 4. 6. -3. 1. 4. 10. 2. -7. -8.]
☞ その28・・・整数部の抽出、やり方イロイロ
# 1~5のランダムな数を5つ持つ行列
Z = np.random.uniform(1,5,5)
print (Z)
# 整数の抽出
print (Z - Z%1)
print (np.floor(Z))
print (np.ceil(Z)-1)
print (Z.astype(int))
print (np.trunc(Z))
=>
[ 3.5029238 4.47885352 1.91640941 1.43928684 4.46256647]
[ 3. 4. 1. 1. 4.]
[ 3. 4. 1. 1. 4.]
[ 3. 4. 1. 1. 4.]
[3 4 1 1 4]
[ 3. 4. 1. 1. 4.]
☞ その29・・・5x5 matrix with row values ranging from 0 to 4
Z = np.zeros*6
Z += np.arange(5)
print(Z)
=>
[[ 0. 1. 2. 3. 4.]
[ 0. 1. 2. 3. 4.]
[ 0. 1. 2. 3. 4.]
[ 0. 1. 2. 3. 4.]
[ 0. 1. 2. 3. 4.]]
☞ その30・・・Consider a generator function that generates 10 integers and use it to build an array
◆行列&ベクトルに関する計算
☞ スカラー演算
W = np.array([[1, 2, 3], [4, 5, 6]])
x = np.array([7, 8, 9])
print(W * 2) #要素を2倍
print(-x) #要素にマイナス
=>
[[ 2 4 6]
[ 8 10 12]]
[-7 -8 -9]
☞ 行列を計算する際の方向 ”axis”

W = np.array([[1, 2, 3], [4, 5, 6]])
print(W.sum())
print(W.sum(axis=0))
print(W.sum(axis=1))
=>
21
[5 7 9]
[ 6 15]
◆行列の積 ”matmul”
(1)行列とベクトル
A = np.array([[2,3,4], [3,4,5]]) #行列
y = np.array([1,2,3]) #ベクトル
print(A)
print(y)
print(np.matmul(A, y))
=>
[[2 3 4]
[3 4 5]]
[1 2 3]
[20 26] #積の答え
(2)行列と行列
A = np.array([[2,3,4], [3,4,5]]) #行列
B = np.array([[2,3], [3,4],[4,5]]) #行列
print(A)
print(B)
print(np.matmul(A, B))
=>
[[2 3 4]
[3 4 5]]
[[2 3]
[3 4]
[4 5]]
[[29 38] #積の答え
[38 50]]
print(np.matmul(W, W.T))
print(np.matmul(W.T, W))
◆”dot”積
・行やベクトルしか関係しない計算であればmatmalとdotは差ナシ
A = np.array([[2,3,4], [3,4,5]])
B = np.array([[2,3], [3,4],[4,5]])
print(np.dot(A, B))
=>
[[29 38] #積の答え
[38 50]]
*1:2,3
*2:3,3,3
*3:3,3
*4:4,4),dtype=int)
Z[1::2,::2] = 1
Z[::2,1::2] = 1
print(Z)
=>
[[0 1 0 1]
[1 0 1 0]
[0 1 0 1]
[1 0 1 0]]
☞ その18・・・Consider a (6,7,8) shape array, what is the index (x,y,z) of the 100th element?
print(np.unravel_index(100,(6,7,8)))
=>
(1, 5, 4)
☞ その19・・・tileファンクションを使ってチェックボード
Z = np.tile( np.array([[0,1],[1,0]]), (2,2
*5:3,3
*6:5,5
TensorFlow(その1)
◆MNISTデータのダウンロード(jupyter)
☞ INTERFACE(2017年3月号の67ページ~写経)
・次のコードでデータダウンロード
from tensorflow.examples.tutorials.mnist import input_data
mnist = input_data.read_data_sets("MNIST_data/", one_hot=True)

・4つのファイルがダウンロードされる。
◆画像データの中身
INTERFACE(2017年3月号の67ページ~)
(1)画像データの中身確認
mnist.train.images[0]

(2)その他
・ラベルデータ
mnist.train.labels[0]
・データの数の確認
mnist.train.num_examples
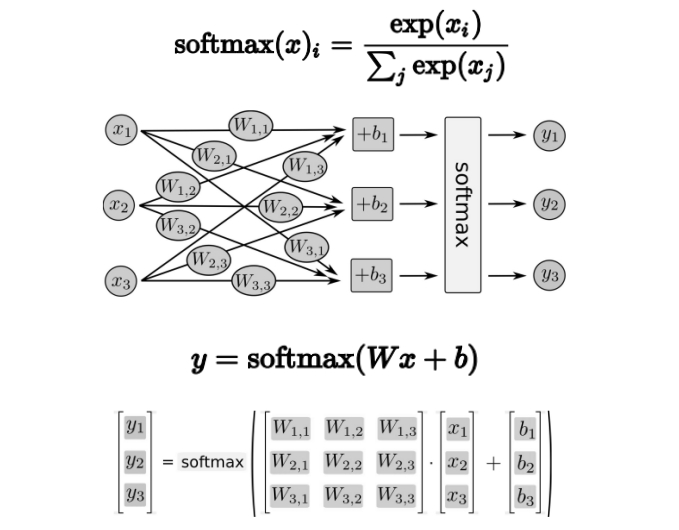
◆ソフトマックス関数
(2017.4.13.)
Matplotlibで画像を表示してみるetc(その1)
◆Python画像処理の写経
(1)画像を読み込んで表示する
import numpy as np
import matplotlib.pyplot as plt
img = plt.imread('***.jpeg')
plt.imshow(img)
plt.show()
(2)画像の保存
plt.imsave('***.jpeg', img)
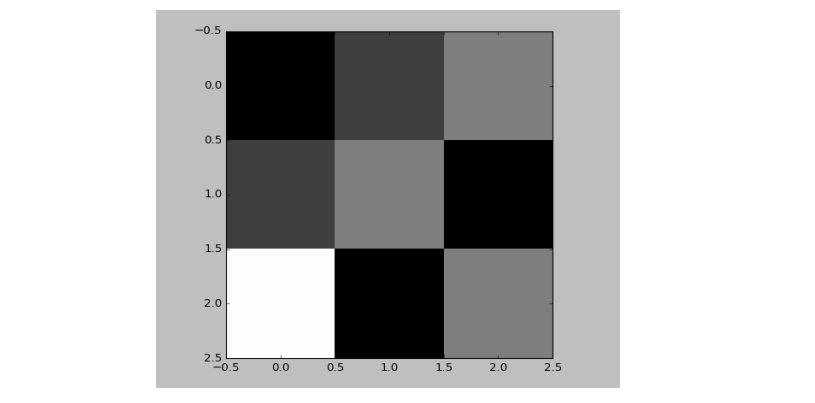

◆Tips
・dtypeの指定 → 白黒では必要なし、カラーのとき使う)
・vmin/vmax → 白黒画像では必要。imshow()で勝手に正規化されないように。
・interpolation = 'none' → 勝手にかかるフィルターを外す
(3-2)RGB画像

◆Tips
・arrayの中身を変えることでRGBA画像(要素4つ)なども表示可能。
・”RGBA”の”A”は、透明度を表すアルファのA。
◆画像を拡大する
・"repeat"を使う
・縦5倍&横3倍にした例


《参考》
・Python画像処理の再発明家 ~行列による画像処理・基礎編&目次~ - Qiita
◆追加(2018-8-3)
(1)Google Colaboratory上でのsin波表示

code:
import numpy as np
import matplotlib.pyplot as plt
x = np.arange(-5, 10, 0.1)
y = np.sin(x)
plt.plot(x, y)
※ jupyter notebookの場合、plt.show() つける
(2)色の指定
import matplotlib.pyplot as plt
import numpy as np

colorlist = ["r", "g", "b", "c", "m", "y", "k", "w"]
x = np.arange(1, 9)
height = np.repeat(1, 8)
plt.bar(x, height, color=colorlist, tick_label=colorlist, align="center")

(2017-3-31)
(追記 2018-8-3)